 Budget Health Analytics
Earned Value Management (EVM) Software
Is the project spending in line with what has actually been done?
Vaizy compares what you planned to spend, what has actually been completed, and what you have actually spent. The result is a clear budget health score with no spreadsheet formulas needed.
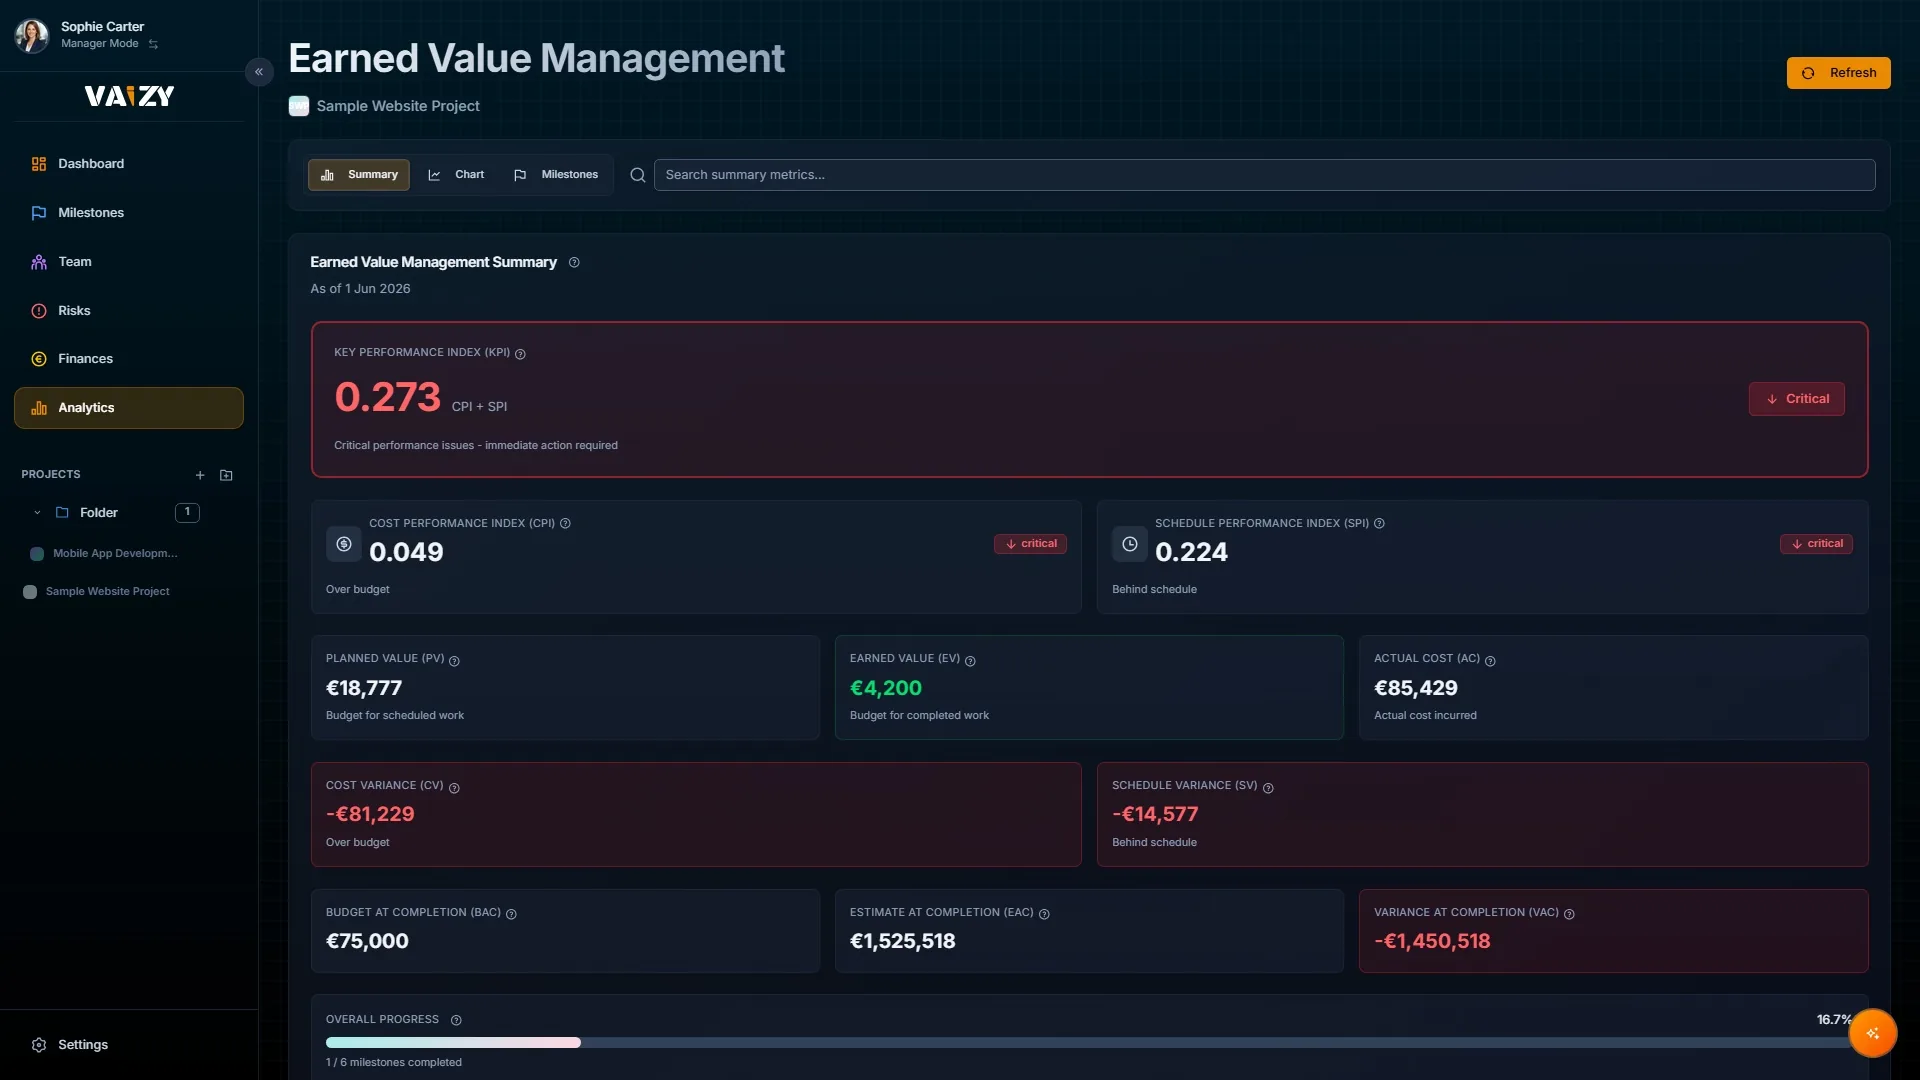
Budget problems creep up week by week. Vaizy tracks planned progress against actual cost so you see drift before it becomes a write-off.
Automatic calculation
Vaizy works out budget health from milestone due dates, work completed, and money spent. You just keep your project data up to date.
A budget health score that shows whether you are spending more than you are getting done.
Progress vs. cost chart
A visual chart shows three lines over time: what you planned to spend, how much work has been completed, and what you have actually spent. When those lines diverge, something needs attention.
A chart that shows planned spend, earned progress, and actual cost plotted over time.
Breakdown by milestone
See which phases of the project are on track and which are dragging the overall picture down. Know where to focus before the next review.
A health status at a glance: Excellent, Good, Warning, or Critical.
Set due dates and budget values for your milestones, and link costs to the relevant milestone as they come in.
Mark work as complete as it gets done.
Click Recalculate to see current budget health, then use the chart and dashboard tiles in your next project review.
Know whether your project is really on track
Budget health calculated automatically from your real data. No formulas, no guesswork.